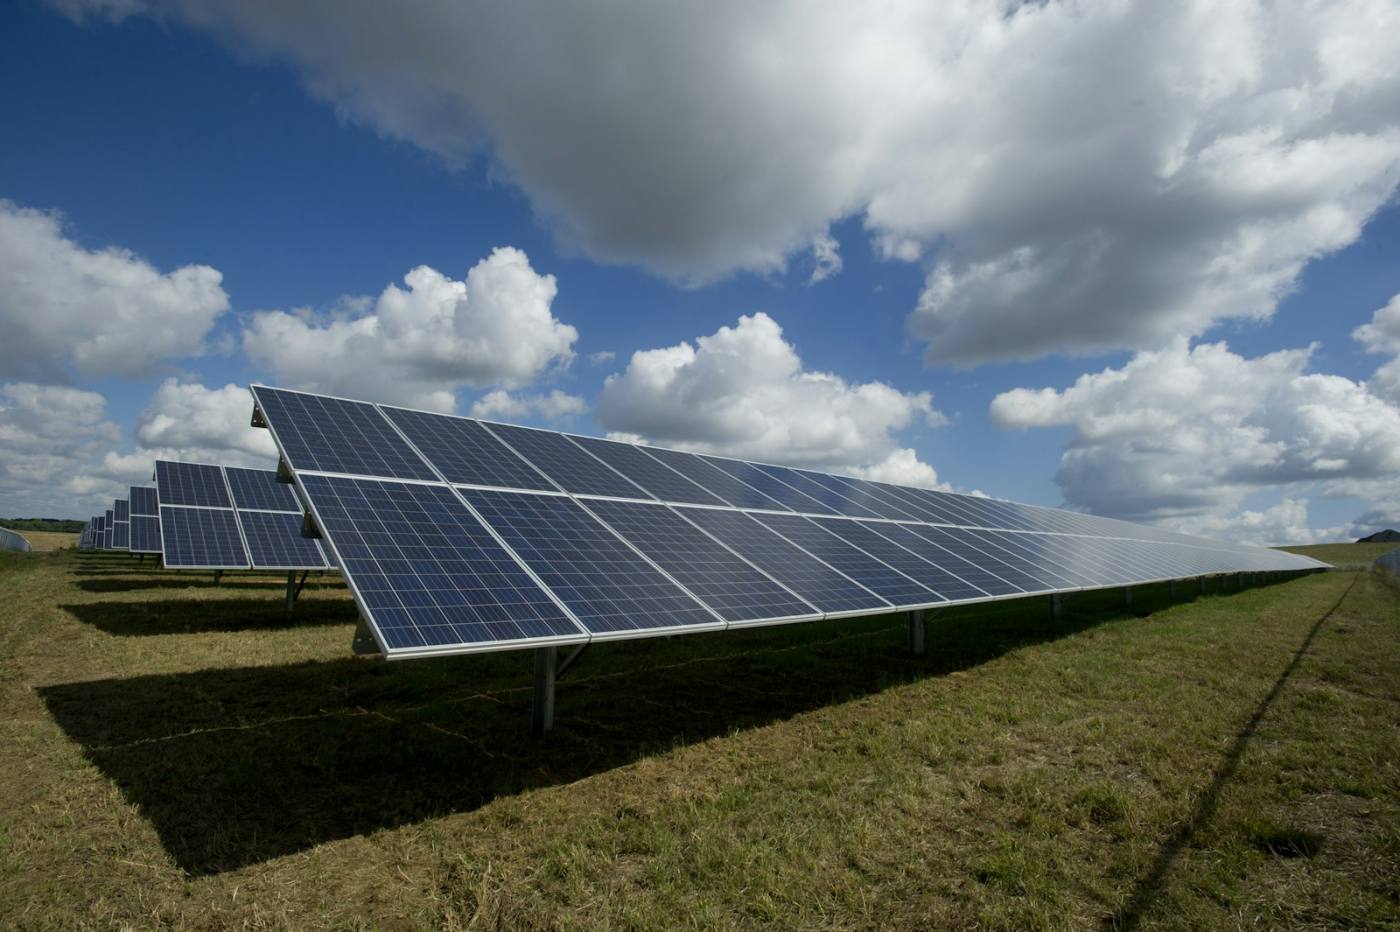
Solar · Mississippi
Mississippi Solar jobs: 1,451 employed (2024)
Solar Jobs in Mississippi (2024)
1,451
Rank #38 of 51
0.39% of U.S.
Mississippi-adjusted median
$49,237
Across 2 tracked solar roles, BEA RPP × 0.87.
Where Mississippi’s clean-energy jobs sit across 8 sectors
| Sector | Jobs (2024) | National rank |
|---|---|---|
| Energy Efficiency | 15,607 | #34 |
| Solar | 1,451 | #38 |
| Electric Vehicles | 984 | #30 |
| Nuclear | 629 | #26 |
| Storage & Grid | 512 | #35 |
| Wind | 306 | #45 |
| Clean Fuels | 153 | #32 |
| Hydropower | 124 | #41 |
Mississippi vs. the solar leader, median, and bottom
1st · California
116,380
25th · Hawaii
4,083
38. Mississippi
1,451
51st · Alaska
163
Solar roles and pay in Mississippi
| Role | SOC | National median | Mississippi-adjusted | Job Zone |
|---|---|---|---|---|
| Electrician | 47-2111.00 | $61,590 | $53,460 | 3 |
| Solar Photovoltaic Installer | 47-2231.00 | $51,860 | $45,014 | 2 |
Employer-reported hiring difficulty in Mississippi
Did not hire
45.8%
Somewhat difficult hiring
27.2%
Very difficult hiring
22.6%
Not at all difficult hiring
4.5%
NAICS industry mix for Mississippi clean-energy jobs
Manufacturing
22,314
Construction
19,208
Other Services
8,422
Utilities
7,611
Trade
5,491
Professional Services
4,284
Mining and Extraction
2,762
Pipeline Transport & Commodity Flows
2,677
Agriculture and Forestry
1,232
Mississippi’s electric-power generation workforce by fuel type
Natural gas electricity
1,844
Solar
1,451
Nuclear electricity
629
Coal electricity
623
Wind
306
Other electricity
200
Traditional hydropower
124
Bioenergy/Combined heat and power
121
Low impact hydropower, marine, and hydrokinetics
76
Geothermal electricity
45
Oil and other fossil fuel electricity
23
Full USEER workbook line items for Mississippi
Fuels
| Fuels total | 10,022 |
| Oil (petroleum and other fossil fuels) | 5,955 |
| Natural gas fuels | 1,503 |
| Woody biomass | 914 |
| Other fuels | 427 |
| Other ethanol and non-woody biomass | 406 |
| Coal fuels | 295 |
| Corn ethanol | 280 |
| Other biofuels | 153 |
| Nuclear fuels | 89 |
Electric Power Generation
| Electric power generation total | 5,442 |
| Natural gas electricity | 1,844 |
| Solar | 1,451 |
| Nuclear electricity | 629 |
| Coal electricity | 623 |
| Wind | 306 |
| Other electricity | 200 |
| Traditional hydropower | 124 |
| Bioenergy/Combined heat and power | 121 |
| Low impact hydropower, marine, and hydrokinetics | 76 |
| Geothermal electricity | 45 |
| Oil and other fossil fuel electricity | 23 |
Transmission, Distribution & Storage
| Transmission, distribution, and storage total | 15,927 |
| Traditional transmission and distribution | 12,891 |
| Other (including commodity flows) | 2,058 |
| Storage | 512 |
| Other grid modernization | 174 |
| Smart grid | 156 |
| Micro grid | 136 |
Energy Efficiency
| Energy efficiency total | 15,607 |
| Other | 4,449 |
| Traditional HVAC with an efficiency component | 4,100 |
| High efficiency HVAC and renewable heating and cooling | 3,217 |
| Advanced materials | 1,963 |
| Certified and efficient lighting | 1,879 |
Motor Vehicles
| Motor vehicle total | 27,002 |
| Gasoline and diesel vehicles | 21,642 |
| Hybrid electric vehicles | 1,504 |
| Other vehicles | 1,175 |
| Battery electric vehicles | 984 |
| Motor vehicle commodity flows | 706 |
| Plug-in hybrid electric vehicles | 673 |
| Hydrogen/fuel cell vehicles | 169 |
| Natural gas vehicles | 150 |
By NAICS Industry
| Manufacturing | 22,314 |
| Construction | 19,208 |
| Other Services | 8,422 |
| Utilities | 7,611 |
| Trade | 5,491 |
| Professional Services | 4,284 |
| Mining and Extraction | 2,762 |
| Pipeline Transport & Commodity Flows | 2,677 |
| Agriculture and Forestry | 1,232 |