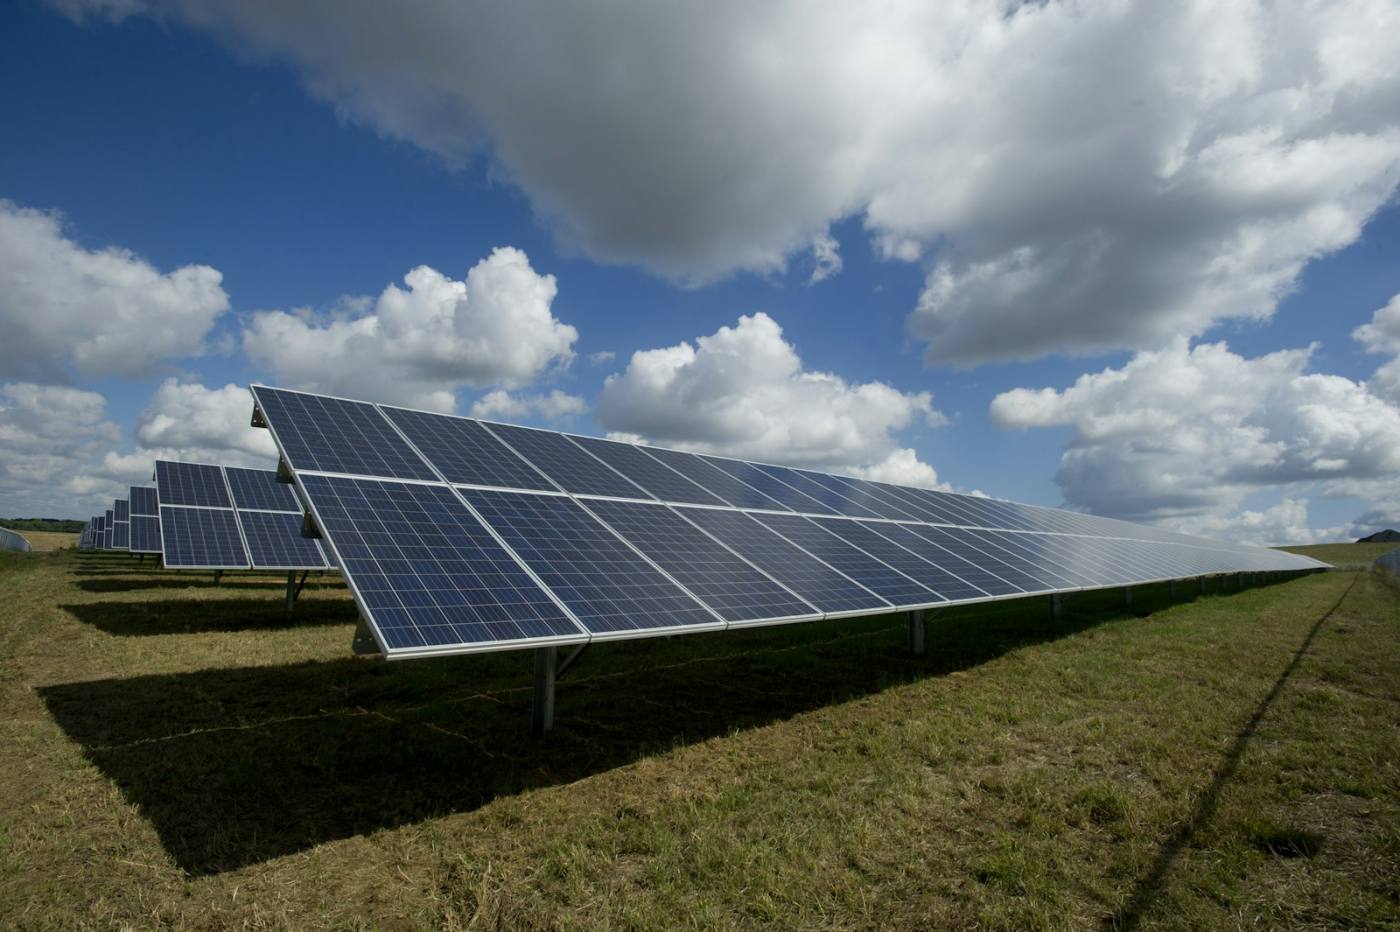
Solar · Missouri
Missouri Solar jobs: 3,807 employed (2024)
Solar Jobs in Missouri (2024)
3,807
Rank #28 of 51
1.03% of U.S.
Missouri-adjusted median
$52,074
Across 2 tracked solar roles, BEA RPP × 0.92.
Where Missouri’s clean-energy jobs sit across 8 sectors
| Sector | Jobs (2024) | National rank |
|---|---|---|
| Energy Efficiency | 42,296 | #20 |
| Solar | 3,807 | #28 |
| Electric Vehicles | 2,661 | #15 |
| Wind | 1,597 | #24 |
| Storage & Grid | 1,065 | #25 |
| Nuclear | 890 | #24 |
| Hydropower | 462 | #19 |
| Clean Fuels | 238 | #24 |
Missouri vs. the solar leader, median, and bottom
1st · California
116,380
25th · Hawaii
4,083
28. Missouri
3,807
51st · Alaska
163
Solar roles and pay in Missouri
| Role | SOC | National median | Missouri-adjusted | Job Zone |
|---|---|---|---|---|
| Electrician | 47-2111.00 | $61,590 | $56,540 | 3 |
| Solar Photovoltaic Installer | 47-2231.00 | $51,860 | $47,607 | 2 |
Employer-reported hiring difficulty in Missouri
Did not hire
51.8%
Somewhat difficult hiring
28.4%
Very difficult hiring
15.3%
Not at all difficult hiring
4.6%
NAICS industry mix for Missouri clean-energy jobs
Manufacturing
41,465
Construction
39,205
Other Services
22,641
Trade
19,813
Pipeline Transport & Commodity Flows
15,761
Utilities
12,472
Professional Services
11,896
Agriculture and Forestry
586
Mining and Extraction
253
Missouri’s electric-power generation workforce by fuel type
Solar
3,807
Coal electricity
1,848
Wind
1,597
Natural gas electricity
1,081
Nuclear electricity
890
Bioenergy/Combined heat and power
741
Other electricity
544
Traditional hydropower
462
Low impact hydropower, marine, and hydrokinetics
230
Geothermal electricity
132
Oil and other fossil fuel electricity
106
Full USEER workbook line items for Missouri
Fuels
| Fuels total | 7,564 |
| Oil (petroleum and other fossil fuels) | 3,513 |
| Corn ethanol | 1,661 |
| Other ethanol and non-woody biomass | 693 |
| Natural gas fuels | 468 |
| Other fuels | 421 |
| Woody biomass | 307 |
| Other biofuels | 238 |
| Nuclear fuels | 142 |
| Coal fuels | 120 |
Electric Power Generation
| Electric power generation total | 11,437 |
| Solar | 3,807 |
| Coal electricity | 1,848 |
| Wind | 1,597 |
| Natural gas electricity | 1,081 |
| Nuclear electricity | 890 |
| Bioenergy/Combined heat and power | 741 |
| Other electricity | 544 |
| Traditional hydropower | 462 |
| Low impact hydropower, marine, and hydrokinetics | 230 |
| Geothermal electricity | 132 |
| Oil and other fossil fuel electricity | 106 |
Transmission, Distribution & Storage
| Transmission, distribution, and storage total | 25,190 |
| Traditional transmission and distribution | 21,387 |
| Other (including commodity flows) | 1,450 |
| Storage | 1,065 |
| Smart grid | 472 |
| Other grid modernization | 442 |
| Micro grid | 374 |
Energy Efficiency
| Energy efficiency total | 42,296 |
| Traditional HVAC with an efficiency component | 20,771 |
| High efficiency HVAC and renewable heating and cooling | 10,877 |
| Certified and efficient lighting | 6,403 |
| Advanced materials | 2,434 |
| Other | 1,811 |
Motor Vehicles
| Motor vehicle total | 77,605 |
| Gasoline and diesel vehicles | 51,334 |
| Motor vehicle commodity flows | 15,060 |
| Hybrid electric vehicles | 4,070 |
| Battery electric vehicles | 2,661 |
| Plug-in hybrid electric vehicles | 1,833 |
| Other vehicles | 1,781 |
| Hydrogen/fuel cell vehicles | 459 |
| Natural gas vehicles | 408 |
By NAICS Industry
| Manufacturing | 41,465 |
| Construction | 39,205 |
| Other Services | 22,641 |
| Trade | 19,813 |
| Pipeline Transport & Commodity Flows | 15,761 |
| Utilities | 12,472 |
| Professional Services | 11,896 |
| Agriculture and Forestry | 586 |
| Mining and Extraction | 253 |
Related in Missouri
Energy Efficiency
42,296 jobs
Electric Vehicles
2,661 jobs
Wind
1,597 jobs
Storage & Grid
1,065 jobs